![]() Marks
Marks
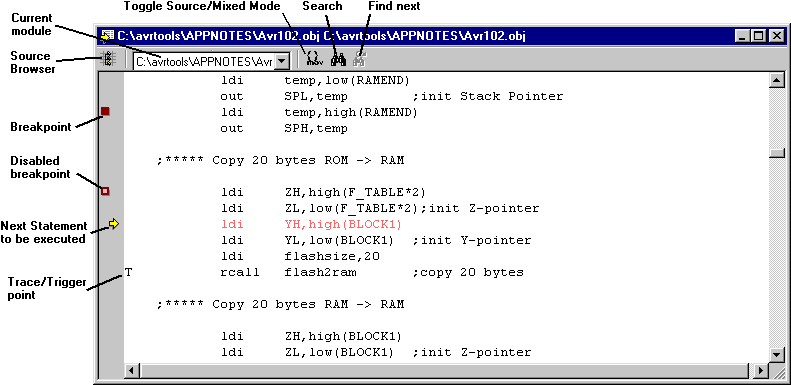
Marks along the right margin indicate the location of the program counter
and other debug points like breakpoints and trace control statements. Breakpoints
are easily defined and deleted by maneuvering in the source window. The
Run to Cursor debug operation also work only when the cursor is positioned
inside the source window.
![]() Debug
Modes
Debug
Modes
The source code can be viewed in several different modes. Depending
on which mode is active, the debugging is carried out on the coresponding
level.
![]() Browse
the modules
Browse
the modules
An object file can consist of several modules. Only one module is displayed
at a time, but the user can change to the other modules by selecting the
module of interest in the selection box on the top left of the Source window.
This is a useful feature for viewing and setting breakpoints in other modules
than the one currently active.
![]() Copy text to Windows Clipboard
Copy text to Windows Clipboard
The Source window supports the Windows Clipboard. The user can select
parts of (or all) the contents in the Source window and copy it to the
Windows Clipboard by selecting Copy from the Edit menu.
![]() Search
Search
The source window supports free text search, limited to current module
or all modules. The first item found will be marked.
![]() Find Next
Find Next
Choose find next (Click on button or Ctrl-N) to find the next item.
Shorcut menu
The Toggle breakpoint, Toggle Trace & trigger, Run to Cursor and
the Copy functions are also available by pressing the right mouse button
in the Source window.